The overview
The overview is the start page and answers the first question after an alert: is something broken, and where? g o brings you back to it from anywhere.
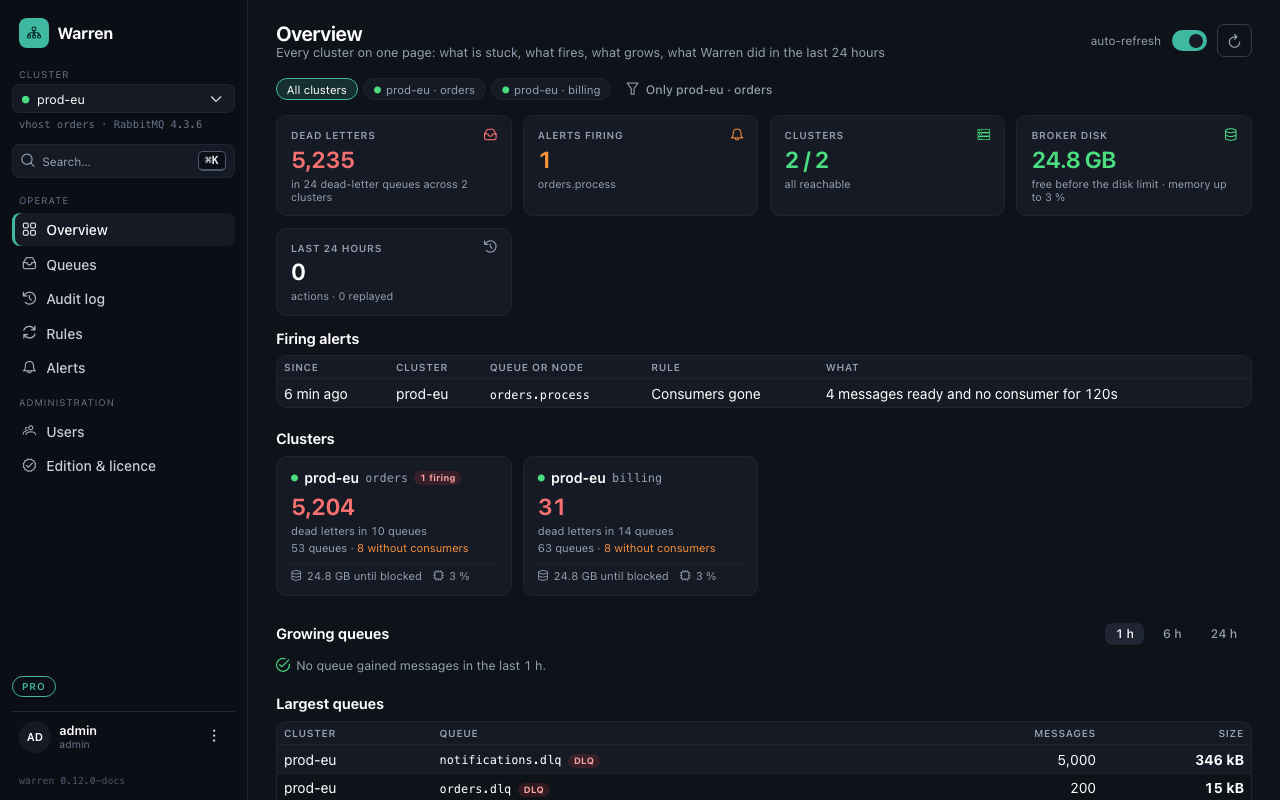
What it shows
- Dead letters across all dead-letter queues of all clusters, and in how many queues.
- Alerts firing right now, each with its rule, queue or node and since when. A cluster with a firing alert says so on its card.
- Clusters reachable and not. One that Warren cannot read is marked, it does not just disappear.
- Broker disk: how much can still be written before RabbitMQ blocks every publisher, and memory use against the high watermark.
- Growing queues: the queues that gained most messages in the last hour, six or 24 hours.
- Largest queues by bytes, the usual suspects when the disk fills up.
- Last 24 hours: what operators and replay rules did.
Room before publishers are blocked
RabbitMQ stops accepting messages from every publisher of the cluster once a node has less free disk than its disk_free_limit or uses more memory than its high watermark. A dead-letter queue that grows unnoticed is a common way to get there. Each cluster card shows the free disk above the limit ("24.8 GB until blocked") and the memory use; when it gets tight the line turns yellow, then red, and during an alarm the Broker disk card says "blocked".
Reading the nodes needs the monitoring tag on Warren's RabbitMQ user. Without it the card says so. To be told before it happens, add a node alert rule such as "Disk running low".
Narrow it down
The chips on top limit the numbers and tables to some clusters; the choice stays in the URL, so a filtered overview can be shared, and is remembered for the next visit. Only … narrows to the cluster selected in the sidebar. A cluster left out that fires or is down is still named above the numbers, so filtering never hides a problem.
Several vhosts of one broker are separate entries; when they share a name, the chips add the vhost.